And here are tips about how to read candlestick chart:
Psychologically, candlestick occur because there are pressures from buyers and sellers. The war between bullish and bearish makes candlestick shape different from one and another.
Building of candlestick :
- If there are a lot of buyers in the market, the market price will rising and at the end of the period market will close above the opening price. This is the way of bullish candlestick formed (green candlestick). The buyer's strength can be measure from the market movement from low to close price. The bigger of the strength more bigger candlestick will formed. In other words the candlestick length reflects of buyers domination.
- If there are a lot of sellers in the market, the market price will moving bearish and at the end of the period market will close below the opening price. This the way of bullish candlestick formed (red candlestick). The seller's strength can be measure from the market movement from high to close price. The bigger of the strength more bigger candlestick will formed. In other words the candlestick length reflects of the buyers domination.

To identify the direction of the next candlestick, there are few things that should be consider.
1. war between bullish and bearish
2. speed of the movement
3. deceleration of the market movement
4. Reversal
5. Convergence
1. The war
When one side dominate the market, the candlestick will move in the same direction. For example if the buyers dominate the market so the candlesticks will move bullish. As long as there are not any fight from sellers candlestick will follow the shape of the previous candlestick.
After some of traders felt that the market is already too high or overbought, then the sellers will fight back. This is caused from profit taking action.
The fight between buyers and sellers is showed by candlestick's tail. And if the war is bigger than domination, so the winner will dominate the market and this situation will change the trend direction or people calls with trend reversal. With this we can identify that the next candlestick will change the direction too.

2. Acceleration of candlestick
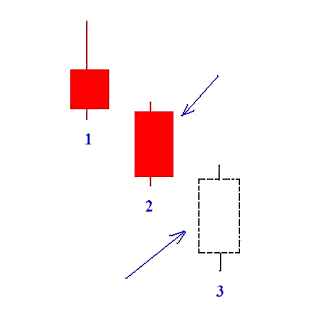
If the candlestick body is bigger than the previous candlestick body it show the enthusiasm of the market. So if there are so many Forex trader open the trading position, this will strength the market in the direction of the trend. Even there are no fight from opponent, in this situation we can predicts the next candlestick is bigger and in the same direction from the previous candlestick trend.

3. Deceleration of candlestick
Deceleration of candlestick is the opposite of enthusiasm, the hesitation of traders to open the trading position will make the market move slow. This hesitation appear because the traders think that the market trend is already too high, too low, oversold, overbought or in support and resistance area. If there are no traders who open the trading position, it makes the market moving slow because the do not have the power.
In this situation like this we have to ready to open trading position in the opposite direction, because the market will take over by buyers or sellers.

4. Candlestick reversal
In the overbought or oversold situation there are a lot of traders who try to end the current trend, they want to turn the trend direction. But this attempt begins with test. They test is the market can really turn the trend direction or not. This attempt is marked by the long candlestick at the opposite trend direction.
The situation is before the market trend over, the candlestick is like to build a candlestick in the opposite trend direction but in the end of the period the market price is pull back and close in the direction of the market trend.
This attempt indicate the market will turn the market trend. In this situation we can prepare to open trading position in the opposite direction.

5. Candlestick convergence
Deceleration and reversal move show the most traders want reversal in the market. But some traders want the market stay in the same trend direction.
In other words if most of peoples want one thing but there is one person wants a different thing. If we look the strength ratio, the one person is weaker and easy to beat.

Convergence candlestick is happen when there are participants want to get the good price, even they are already knew that the market will reverse. In this situation we can look in other indicator, if the other indicator also shows convergence potential so we can open a new trading position in the opposite direction of the market trend.
other posts
- Bollinger Bands trading system
- Auto Elliott wave Indicator
- Trend Forex Trading Strategy
- Accumulation and Distribution Indicator
- Multiple Moving Average Indicator
Indicators you can download for free
- Zz Ensign Fibo
- Dinapoli targets indicator
- Heiken Ashi Reversal
- Dual Moving Average Crossover
- Channel Breakout Mt4

0 comments:
Post a Comment
IF YOU WANT TO KNOW ANYTHING about Forex trading system, Forex indicator, Expert Advisor, etc. and you want me to write about it - YOU CAN ASK ME using comment box.