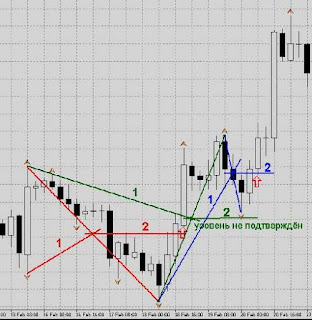
Check at the image above, this system is very simple and easy
1. line 1 is the your guidance for your trading. This line show you a trading position level. We open trading long or short with this mid level. You can draw this mid line from the previous bottom or top level of the first wave to trough the mid of second wave. You can use fibonacci line 50% to help you in identify the mid point of the second wave.
Draw a horizontal line from mid point of the second wave, and then you wait market price cross trough this horizontal line close above or below it and you can open a trading position in the direction of the cross.
Line 2 indicates your trading level, and you should wait closing price trough this horizontal line and we can open a trading position at the opening price of the next candlestick.
Just take a look at the trading example below.

At the second chart image you can see the real trading using mid wave trading system. Red arrow represents entry level into the forex market at the opening price of the new candlestick.

You can place stop loss level at the above or below of the second wave. Set profit target twice of your trading risk or you can use trailing stop.


0 comments:
Post a Comment
IF YOU WANT TO KNOW ANYTHING about Forex trading system, Forex indicator, Expert Advisor, etc. and you want me to write about it - YOU CAN ASK ME using comment box.