How to Trade Ichimoku
Ichimoku Kinko Hyo consists of five lines, and you have to learn deeply all of them before you get further with ichimoku kinko hyo.
trade ichimoku
Senkou Span A, this line is the middle level between tankan sen and kijunsen, tankan sen means conversion level and kijunsen means base line.Thesenkou span A makes one of the 2 clouds. This line ichimoku is acted as “Leading” because senkou span is attached 26 days in the future and builds the faster cloud movement.
Senkou Span B – this Indicator line is the middle level of the 52 periods Hi Lo range on the D1 time frame chart. The basic setting formula is 52 days, but we can change it. The value is attached 26 days in the future and builds the slower cloud movement.
Kijunsen, this indicator line is the middle level of the 26 periods Hi Lo range on D1 time frame chart, or almost one month.
Tenkansen : this ichimoku line is the middle level of the 9 periods, or almost 2 weeks.
How to Trade Ichimoku
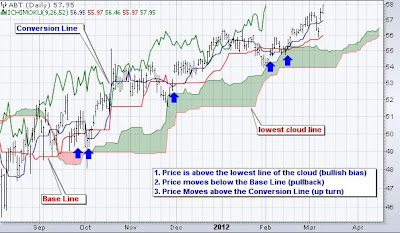
Traders use the cloud to determine the trend direction and decide a decision. After they decided the trend direction, traders wait for a reversal or a corrective movement when the prices cross the Kijunsen line. A signal occurs if price cross the tenkan sen to give signal an end to the pullback.
This Ichimoku system will give 3 kinds for uptrend signal.
1. The Kijun sen trades above the price to give signal a reversal and
2. The trend is up if the lowest line of the cloud indicator is below the price. The market prices remain trade above the cloud support and improve the risk and reward ratio for new buy.
3. If the prices pullback and the conversion level trades above the price, then a uptrend signal occurs.
When you read the 3 criteria above, they will not be acted in only a single day. First, the market trend is uptrend as determined by the cloud line. 2nd, the price correction with the trade below the kijunsen. 3rd, the market price moves back up with a trade above the conversion line.
Ichimoku long signal conclusion
• The conversion line trades below the price
• The lowest line of the cloud indicator below the market price (uptrend bias)
• The Kijun sen trades above the price (correction)
Trade Ichimoku
Now we talk about the bearish bias. The downtrend signal also has 3 criteria.
1. When the market pullback and trade ichimoku below the conversion line
2. The kijun sen trades below the market to signal a pullback within a stronger bearish trend
3. When the highest line of the cloud indicator is above the market price, then the signal is downtrend.
Ichimoku short signal conclusion
• The conversion line trades above the price
• The highest line of the cloud ichimoku is above the market price (downtrend signal)
• The kijunsen trades below the market price
Trade Ichimoku
How to trade Ichimoku
When you see the example below there are 5 opportunities over 12 months. The market price moved bearish from January until August, the signals occurred 3 times from January to June. First and second bias occurred in sideways because the price didn’t keep the cloud line indicator. The signal can swap frequent for volatile prices because the cloud ichimoku is lagging indicator.
Trade Ichimoku
A strong trend is needed to hold a signal. Market prices still above the lower cloud ichimoku line throughout a strong bearish trend and below the above cloud ichimoku through a bearish trend.
The signal occurred to downtrend in June and kept downtrend as a strong bearish movement extended. There were 2 bearish signals through this stage. Trading bias 3 made in a sideways, but trading bias 4 lead a bearish movement.
Trade Ichimoku
After a pullback in Augusts, the signal changed uptrend with the bullish breakout in September and kept uptrend. The 1st pullback made a bullish bias (50 with a bottom below the Kijunsen (red line) and following trade above the conversion line. Through the association phase, there were 2 more bullish bias. (6 & 7)
To confirm signals, Foreign exchange trader can use volume. A bullish signal with high volume would give more accurate than a bullish signal on low volume. Growing volume means big sentiment and this improves the opportunities of a position. Traders also need to analyze a system for stops, this stops level can be based on support and resistance level on the current price or can be based on ichimoku indicator itself. It is better to set stop loss before we open a position.
Trade ichimoku
Or you can use ATR average true range technical indicator, this tool can be traded to decide a stop loss order. Forex traders usually plot stops 2 ATRs above the current stock for buy position and 2 ATRs above the market price on sell position.
Ichimoku gives traders to determine signals, determine pullback and reversal levels. The blue line or conversion line indicator is a line indicator made to determine reversal early. Determining the pullback early will increase the risk and reward ratio for trades. How to trade Ichimoku


0 comments:
Post a Comment
IF YOU WANT TO KNOW ANYTHING about Forex trading system, Forex indicator, Expert Advisor, etc. and you want me to write about it - YOU CAN ASK ME using comment box.