


Parabolic SAR Strategy Forex
In the previous article we talked about how to catch the beginning of the new trend. But the most important for use is, how to determine the market trend. When to entry and when to exit trading?
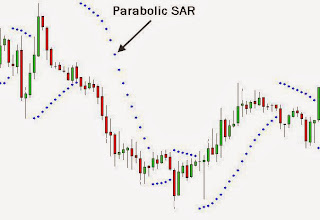 Forex technical indicator which can assist us to identify the level where the market trend could end is Parabolic SAR indicator. Parabolic SAR gives dots on your trading chart that show the potential level for trend reversal. On the chart above we can see the dots are plotted above the market price when the market is in bearish trend and dots are plotted below the market price when the market is in bullish trend.
0 comments:
Post a Comment
IF YOU WANT TO KNOW ANYTHING about Forex trading system, Forex indicator, Expert Advisor, etc. and you want me to write about it - YOU CAN ASK ME using comment box.